Table of Contents
Performance Monitor – Configuring log size and event overwriting policies
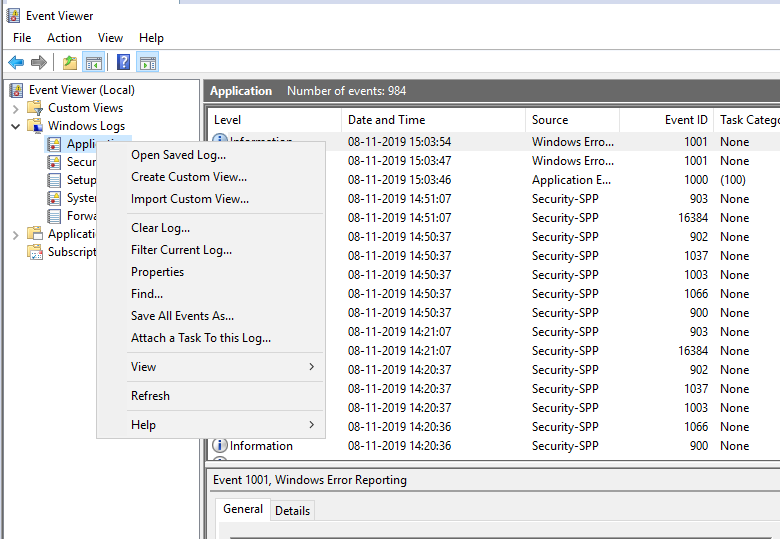
Open server manager from tools clicks on event viewer. In Windows Server 2016 if you start seeing “event log is full” errors verify that automatic overwriting of the oldest event is enabled, and deadlock has sufficient at least 20 megabytes.
To set a maximum size for a log right click on the application and select properties overslept application and click Properties in the action panel.

The interlock size section sets the maximum block size to 20480 megabytes this is the recommended size for a log. Do not make the log too big, SD consumes disk space, and might Mac filtering the event slowly. In Windows Server 2016, the block size is 20 megabytes by default.
Underwent maximum block size is reached select overwrite event as needed

Performance Monitor – Filter current log
In Windows Server 2016, open event viewer and right-click the windows logs whose log you want to filter, for example, right-click the application and click on filter current log.
In Windows Server 2016 critical warning and error box. Please display only failure-related events after clicking ok. You might also want to select a value from logged: box for filtering events by time- predefined values are last hour, last 12 hours last 24 hours last 7 days, and last 30 days. You can also specify your own time frame by choosing a custom range.
To see only events for a specific user, the name of the user into the user field.

Performance Monitor – Creating custom view
In event viewer, select custom views and action pane click on create a custom view. In creating a custom view window select critical warnings and errors at the event level. From the drop-down list in the event log expand window logs and select application and system, then click on ok

Performance monitor

Performance Monitor – Capturing counter data with data collector set
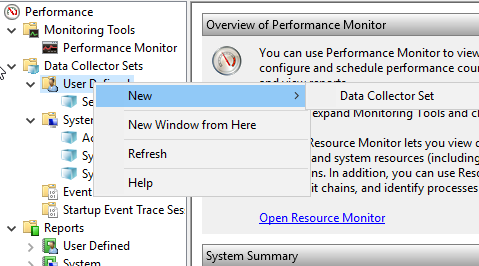
Go to run, in that type of performance, and press enter. Performance Monitor will appear. Then expand data collector sets, then right-click user-defined and select new, click on data collector set.
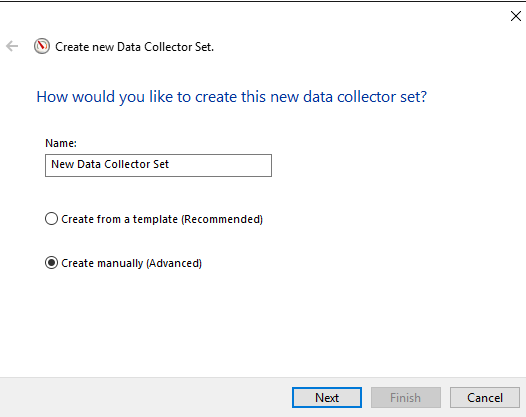
In configuration wizard, assign the name and select create manually advance and click next
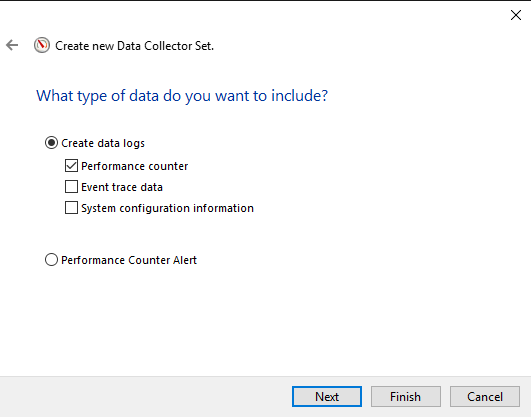
In what type of data do you want to include screen, flight performance counter and I create the data log and click finish
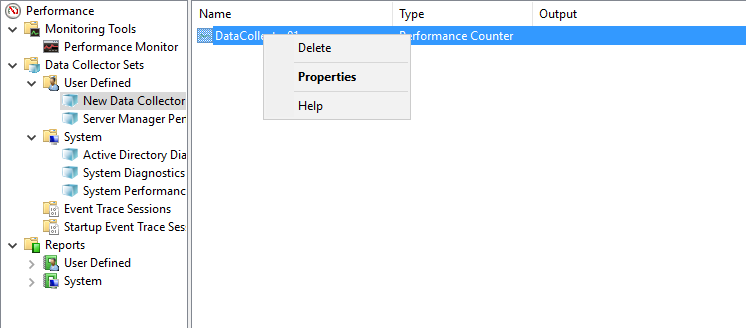
Under user-defined double click the newly created data collector. In that, you can see data collector 01 right-click and go to properties
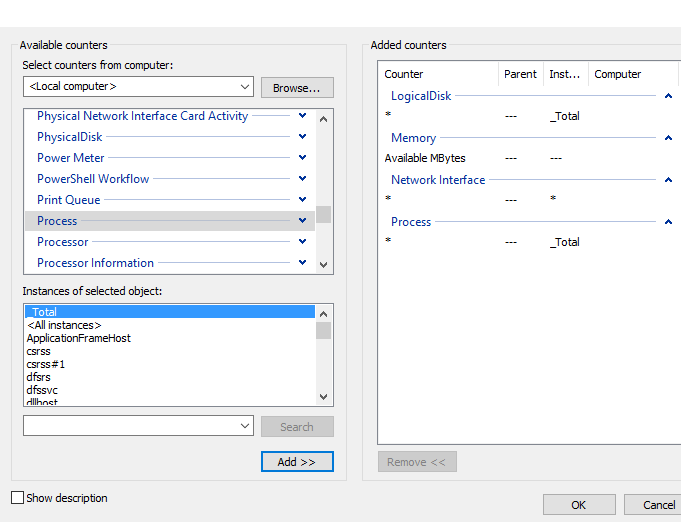
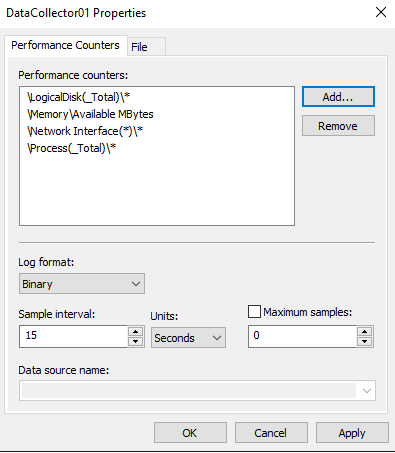
In data collector 01 properties click on add.
From the available counters select the logical disk and click on add expand memory and select available megabytes then click on add select network interface click add and final is left processor click at then click on ok.
Verify the data collector 0/1 properties and click on ok
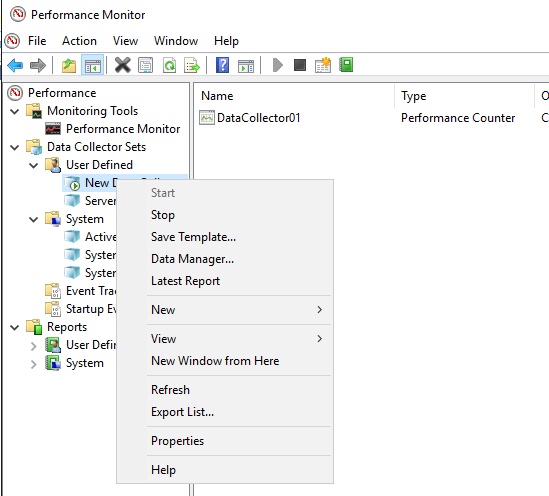
Now right-click the newly created data collector and click start
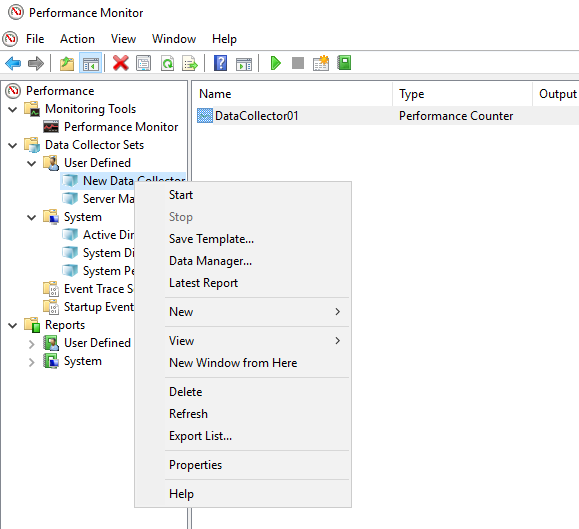
Wait for the data collector to collect the information. After the data collector has collected the information right-click the newly created data collector and click stop.
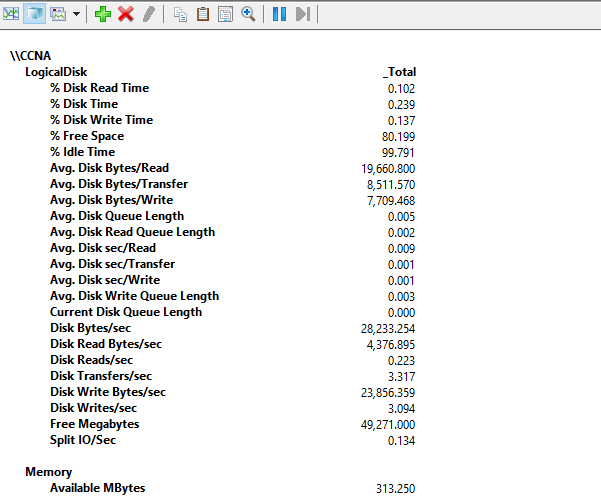
Now in performance monitor expand reports user-defined and newly created data collector that is PMDN then select generated report as shown in the figure. Then from the change graph type dropdown list select report to view the generated report in an understandable format.
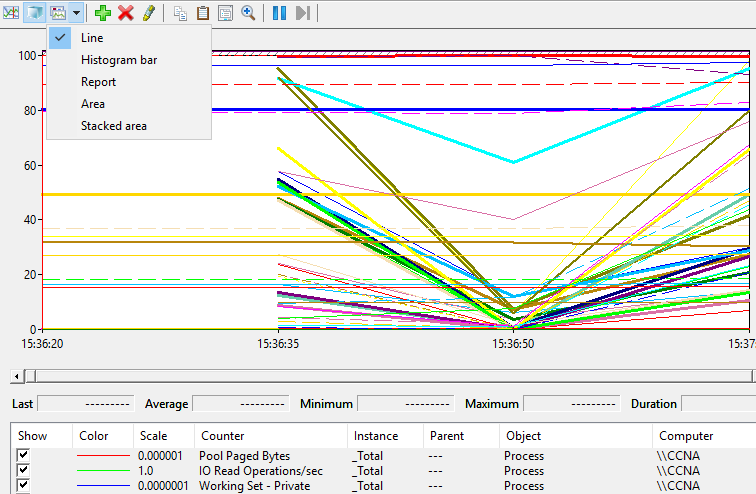
Check the performance report